

Advance Technical Analysis Course (ATAC)
Seasoned traders are known to utilize the technical indicators and charting analysis as a means to deal with the deterioration in the market and identifying potential trade openings, reasonable passage and leave focuses.
An entire class of traders puts the candle graphs to use when taking a gander at value information and it is somewhat difficult to fathom the reason behind it. The candlesticks represent the metaphorical fight amidst buyers as well as the sellers in an easy-to-interpret graphical form. Candle diagrams have their very own scope of patterns, with many focusing on the psychology of the market and continual fight amongst buyers and sellers.
ATAC is the tactical tool for breaking down the financial instruments, including securities, fates and loan fee items, with just market-conveyed data, for instance, value, volume, unpredictability, and open premium. The instruments of Technical Analysis are estimates and subordinates of cost, for instance, on-balance volume, value oscillators, energy estimations and pattern acknowledgment. It is the Technical Analyst's job to effectuate such devices, meant for determining and subsequently timing the trades and the investments. It empowers a trader to attain control over all the components of this field.
This course shall emphasize more on the in-depth knowledge about technical analysis, hence, resulting in more profitable trades.
You will learn how to work in these patterns using our Proven Strategies. With Live Market Trade, We will help you master theses in Indian and well as International Share Market.
More Research, More Trades, and More Chart Patterns
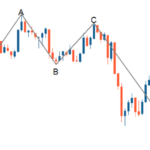
The rhythmic value maneuvers produce symmetric rallies and decline to give traders leeway to determine the key defining moments. Symmetry can be observed in all markets and in different time frame charts.
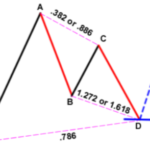
The ABCD pattern is a piece of the outstanding gathering of harmonic patterns. A few traders allude the ABCD pattern as AB=CD.
The ABCD is viewed as an effortless harmonic pattern. One of the reasons behind it is that it has essentially fewer requisites than a majority of the traditional setups. Furthermore, the ABCD arrangement is tremendously simple to perceive the value outline.
In order for an individual to be able to spot this chart pattern, all an individual is required to be equipped with, are: observational skills, presence of mind and the innovative Fibonacci chart tool.
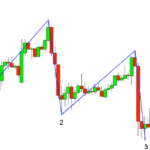
The three-drive pattern is quite similar to the ABCD pattern except that it has three legs, which are referred to as 'drives' and two corrections or retracements.
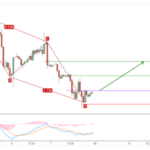
During the times when the market is exhibiting a decadent trend, an inverted yield curve slope or inversion can emerge as an effective means of mitigating threats by predicting recession probabilities using statistical models. The function of an Inverted yield curve isn't confined exclusively to recession prediction but extends to reflecting market demeanor towards various risks that are influenced by economic outcomes.
ATAC accommodates a spectrum of such strategies that are required for an individual to become a profitable trader.
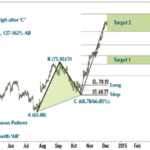
A graph pattern that relies upon the Fibonacci Numbers or proportions is a retracement and continuation pattern which happens when a pattern inverts momentarily prior to advancing in the first bearing. When the pattern concludes and the value begins turning around, it provides generally safe section setups.
'222' has been coined Profits in the Stock Market, the page number on which this graph is found in Gartley's book called 'Profits in the Stock Market.' Acquiring knowledge about the Gartley graph shall helps the stock market traders in finding lucrative entry points to jump in on the over all trend.
Inconceivably resembling the basic butterfly spread, the bull butterfly spread is used to attempt and benefit from an impartial standpoint, but with a variation in accordance with the strikes to transform it into bullish. It is put to use when a trader anticipates the price of a stock to go up and has the precise idea of the value it will eventually touch.
It is an ingenius technique that comprises of three exchanges and yet it generally has low forthright expense. It is not quite common for an alternatives trading system to be optimised for utilizing either calls or puts for usually a similar return.
It's a mind-boggling technique that includes three exchanges, yet it has a generally low forthright expense. Nonetheless, uncommon for an alternatives trading system, it tends to be set up utilizing either calls or puts for generally a similar return.

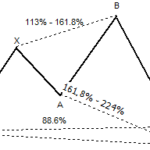
Scott Carney devised a 5-point retracement structure in the year 2001. This technical analysis strategy consists of explicit Fibonacci estimations for every point integrated into its structure.
The Bat strategy seems somewhat similar to the Gartley 222 Butterfly pattern, however, quite a minute difference in regards to the Fibonacci proportions the swing/rotate focuses, sets it apart.

The Crab pattern is like a Butterfly pattern in that it is an inversion pattern made out of four legs checked X-An, A-B, B-C and C-D.
Like the Butterfly, it can enable you to recognize when a present value move is likely moving toward its end. This implies you can enter the market similarly as the value switches heading.
The Harmonic Shark pattern is a moderately new trading pattern that was found in 2011 by Scott Carney. The shark pattern is fairly like the crab pattern recognized by the overextended swing/turn point.
Duration of the course
1 Month
15 Classes